London monthly weather averages
What's the weather like in London?
London has a temperate climate, which means that it has cool winters, warm summers, and plenty of rainfall. Oh, and did we mention it rains a lot!
Summers in London are generally warm and humid with average temperatures ranging from 17 to 21 degrees Celsius (62 to 70 degrees Fahrenheit). Winters are generally mild, with an average temperature range of 5 to 8 degrees Celsius (41 to 46 degrees Fahrenheit) with temperatures rarely dropping below freezing. Rainfall is common throughout the year, with April, May, and June being statistically drier. Snow is quite rare, but does occur occasionally.
London is known for its sudden changes in weather, so it's important to be prepared for all kinds of conditions. The best time to visit London is during the spring and summer months when temperatures are warm and rainfall is at its lowest. However, London is a beautiful city to visit any time of year, and the weather is rarely a reason to stay away.
Average daytime temperature
The bar chart below shows the average monthly peak daytime temperatures at London


| Jan | Feb | Mar | Apr | May | Jun | Jul | Aug | Sep | Oct | Nov | Dec | |
|---|---|---|---|---|---|---|---|---|---|---|---|---|
| °C | 6.8 | 7.2 | 9.8 | 12.6 | 16.4 | 19.7 | 21.7 | 21.4 | 18.7 | 14.9 | 10 | 7.7 |
| °F | 44.2 | 44.9 | 49.7 | 54.6 | 61.6 | 67.4 | 71.1 | 70.5 | 65.6 | 58.8 | 49.9 | 45.9 |
Please note: these are the average peak daytime temperatures (usually around mid-afternoon) so do not show daytime / night highs and lows. To see the daily range of temperatures have a look at the temperature max / min chart below.
Average rainfall & rainy days
The graph below shows the average rainfall and number of rainy days per month.


| Jan | Feb | Mar | Apr | May | Jun | Jul | Aug | Sep | Oct | Nov | Dec | |
|---|---|---|---|---|---|---|---|---|---|---|---|---|
| mm | 55 | 38 | 49 | 47 | 52 | 52 | 49 | 56 | 55 | 58 | 59 | 59 |
| inches | 2.2 | 1.5 | 1.9 | 1.9 | 2 | 2.1 | 1.9 | 2.2 | 2.2 | 2.3 | 2.3 | 2.3 |
| Rainy days | 16 | 12 | 14 | 14 | 13 | 11 | 10 | 11 | 11 | 13 | 15 | 14 |
Average annual rainfall in London: 679mm (267.3 inches)
Average daily sunshine
The bar chart below shows the average daily sunshine hours in London

| Jan | Feb | Mar | Apr | May | Jun | Jul | Aug | Sep | Oct | Nov | Dec | |
|---|---|---|---|---|---|---|---|---|---|---|---|---|
| Hrs sunshine | 1.9 | 2.6 | 3.8 | 5.2 | 6.6 | 7 | 6.6 | 6.5 | 5.2 | 3.9 | 2.5 | 1.7 |
Day / night temperatures
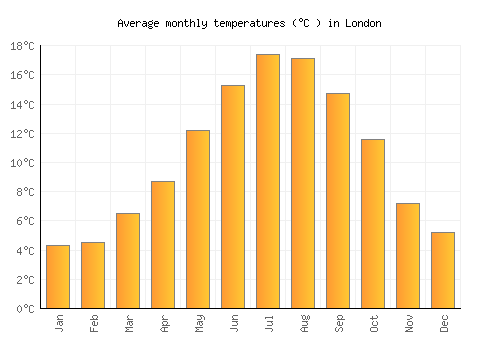
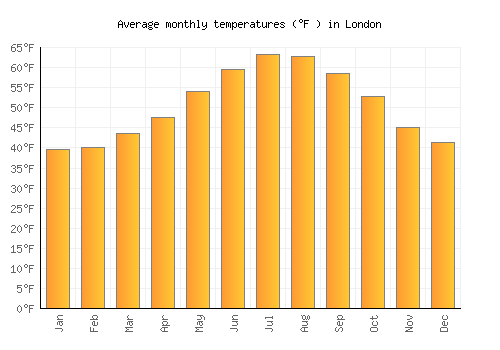
The graph below shows the daily range of temperatures for each month.


| Jan | Feb | Mar | Apr | May | Jun | Jul | Aug | Sep | Oct | Nov | Dec | |
|---|---|---|---|---|---|---|---|---|---|---|---|---|
| Min °C | 1.7 | 1.7 | 3 | 4.7 | 7.8 | 10.7 | 12.9 | 12.6 | 10.6 | 8.2 | 4.3 | 2.6 |
| Max °C | 6.9 | 7.3 | 10 | 12.8 | 16.7 | 19.9 | 22 | 21.6 | 18.9 | 15.1 | 10.1 | 7.9 |
| Min °F | 35.1 | 35.1 | 37.4 | 40.4 | 46 | 51.3 | 55.1 | 54.7 | 51 | 46.7 | 39.7 | 36.6 |
| Max °F | 39.7 | 40.1 | 43.7 | 47.7 | 54 | 59.5 | 63.3 | 62.8 | 58.5 | 52.9 | 45 | 41.4 |
Sea temperature
The graph below shows the average sea temperature.


| Jan | Feb | Mar | Apr | May | Jun | Jul | Aug | Sep | Oct | Nov | Dec | |
|---|---|---|---|---|---|---|---|---|---|---|---|---|
| °C | 8.9 | 7.9 | 7.9 | 9.1 | 11 | 13.3 | 15.5 | 17 | 17 | 15.6 | 13.2 | 10.7 |
| °F | 48 | 46.2 | 46.2 | 48.4 | 51.8 | 55.9 | 59.9 | 62.6 | 62.6 | 60 | 55.7 | 51.3 |
Wind speed
The graph below shows the average wind speed.


| Jan | Feb | Mar | Apr | May | Jun | Jul | Aug | Sep | Oct | Nov | Dec | |
|---|---|---|---|---|---|---|---|---|---|---|---|---|
| km/h | 17 | 17 | 17 | 16 | 15 | 14 | 13 | 13 | 13 | 13 | 16 | 16 |
| mph | 10 | 10 | 10 | 10 | 9 | 9 | 8 | 8 | 8 | 8 | 10 | 10 |
A monthly average windspeed of over 16km/h or 10mph suggests a location is fairly windy.
Relative humidity
The graph below shows the average relative humidity.

| Jan | Feb | Mar | Apr | May | Jun | Jul | Aug | Sep | Oct | Nov | Dec |
|---|---|---|---|---|---|---|---|---|---|---|---|
| 88% | 85% | 80% | 77% | 75% | 74% | 74% | 76% | 80% | 85% | 88% | 90% |

Other monthly averages
London weather stats
| Hottest month: | July | 21.7°C 71.1°F |
|---|---|---|
| Driest month: | February | 38mm 1.5ins |
| Sunniest month: | August | 6.5hrs |
| Coldest month: | January | 6.8°C 44.2°F |
| Wettest month: | December | 59mm 2.3ins |
| Warmest sea: | August | 17°C 62.6°F |


Locations nearby
Top United Kingdom locations
- Belfast
- Birmingham
- Blackpool
- Bournemouth
- Brighton
- Cardiff
- Edinburgh
- Glasgow
- Liverpool
- London
- Manchester
- Newquay
- Oxford
- St Ives
- Swansea
- Torquay
- Weymouth
- Windsor
- York