Tokyo monthly weather averages
What's the weather like in Tokyo?
Tokyo has a humid subtropical climate (Köppen climate classification: Cfa), with hot, humid summers and mild to cool winters with occasional cold spells. Summers temperatures range from an average of 80°F (27°C) in June to 86°F (30°C) in August when temperatures can reach up to 95°F (35°C).
Winters in Tokyo are mild and damp, with temperatures ranging from an average of 40°F (4°C) in December to 47°F (8°C) in February. The coldest part of winter is in January, when temperatures can drop down to 28°F (-2°C). Spring and fall/autumn are mild and pleasant; temperatures range from an average of 50°F (10°C) in April to 68°F (20°C) in October.
Rainfall is quite evenly distributed throughout the year, but the wettest months are June, July and September. Snow is rare in Tokyo, but the city does usually get some snowfall each winter.
Average daytime temperature
The bar chart below shows the average monthly peak daytime temperatures at Tokyo
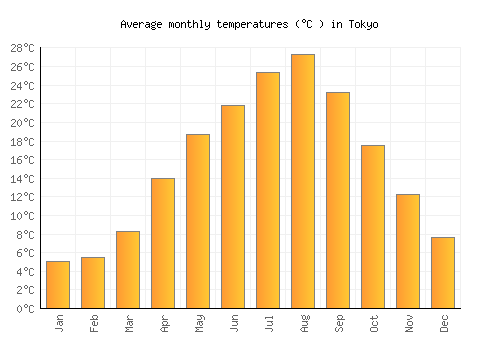
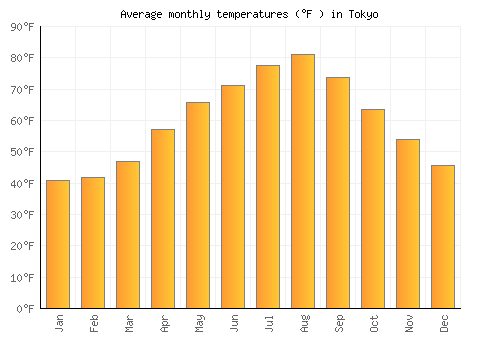
| Jan | Feb | Mar | Apr | May | Jun | Jul | Aug | Sep | Oct | Nov | Dec | |
|---|---|---|---|---|---|---|---|---|---|---|---|---|
| °C | 9.5 | 9.8 | 12.7 | 18.3 | 22.8 | 25.1 | 28.6 | 30.8 | 26.4 | 21.2 | 16.4 | 12 |
| °F | 49.1 | 49.6 | 54.8 | 65 | 73 | 77.2 | 83.5 | 87.4 | 79.6 | 70.1 | 61.6 | 53.7 |
Please note: these are the average peak daytime temperatures (usually around mid-afternoon) so do not show daytime / night highs and lows. To see the daily range of temperatures have a look at the temperature max / min chart below.
Average rainfall & rainy days
The graph below shows the average rainfall and number of rainy days per month.


| Jan | Feb | Mar | Apr | May | Jun | Jul | Aug | Sep | Oct | Nov | Dec | |
|---|---|---|---|---|---|---|---|---|---|---|---|---|
| mm | 43 | 58 | 95 | 119 | 132 | 181 | 128 | 147 | 181 | 158 | 84 | 44 |
| inches | 1.7 | 2.3 | 3.7 | 4.7 | 5.2 | 7.1 | 5 | 5.8 | 7.1 | 6.2 | 3.3 | 1.7 |
| Rainy days | 9 | 11 | 16 | 16 | 16 | 20 | 19 | 16 | 19 | 16 | 12 | 9 |
Average annual rainfall in Tokyo: 1545.4mm (608.4 inches)
Average daily sunshine
The bar chart below shows the average daily sunshine hours in Tokyo

| Jan | Feb | Mar | Apr | May | Jun | Jul | Aug | Sep | Oct | Nov | Dec | |
|---|---|---|---|---|---|---|---|---|---|---|---|---|
| Hrs sunshine | 6.4 | 6 | 5.9 | 5.8 | 6.3 | 4.4 | 4.8 | 6.2 | 4.2 | 4.7 | 5.2 | 6.1 |
Day / night temperatures
The graph below shows the daily range of temperatures for each month.


| Jan | Feb | Mar | Apr | May | Jun | Jul | Aug | Sep | Oct | Nov | Dec | |
|---|---|---|---|---|---|---|---|---|---|---|---|---|
| Min °C | 0.3 | 1 | 3.7 | 9.5 | 14.4 | 18.4 | 22.1 | 23.7 | 19.8 | 13.7 | 8 | 3 |
| Max °C | 9.7 | 10 | 12.9 | 18.6 | 23 | 25.3 | 28.8 | 31 | 26.6 | 21.4 | 16.7 | 12.3 |
| Min °F | 32.5 | 33.8 | 38.7 | 49 | 57.9 | 65 | 71.7 | 74.6 | 67.6 | 56.6 | 46.3 | 37.3 |
| Max °F | 41 | 41.9 | 46.9 | 57.2 | 65.7 | 71.2 | 77.7 | 81.1 | 73.8 | 63.5 | 54.1 | 45.7 |
Sea temperature
The graph below shows the average sea temperature.


| Jan | Feb | Mar | Apr | May | Jun | Jul | Aug | Sep | Oct | Nov | Dec | |
|---|---|---|---|---|---|---|---|---|---|---|---|---|
| °C | 16.7 | 15.7 | 15.9 | 17.3 | 19.9 | 22.2 | 24.5 | 26.3 | 25.3 | 22.9 | 20.9 | 18.6 |
| °F | 62.1 | 60.3 | 60.6 | 63.1 | 67.8 | 72 | 76.1 | 79.4 | 77.6 | 73.2 | 69.6 | 65.5 |
Wind speed
The graph below shows the average wind speed.


| Jan | Feb | Mar | Apr | May | Jun | Jul | Aug | Sep | Oct | Nov | Dec | |
|---|---|---|---|---|---|---|---|---|---|---|---|---|
| km/h | 11 | 12 | 12 | 12 | 11 | 10 | 9 | 10 | 10 | 10 | 10 | 10 |
| mph | 7 | 7 | 7 | 7 | 7 | 7 | 6 | 7 | 6 | 6 | 6 | 6 |
A monthly average windspeed of over 16km/h or 10mph suggests a location is fairly windy.
Relative humidity
The graph below shows the average relative humidity.

| Jan | Feb | Mar | Apr | May | Jun | Jul | Aug | Sep | Oct | Nov | Dec |
|---|---|---|---|---|---|---|---|---|---|---|---|
| 54% | 56% | 59% | 66% | 69% | 76% | 79% | 76% | 77% | 71% | 65% | 59% |

Other monthly averages
Tokyo weather stats
| Hottest month: | August | 30.8°C 87.4°F |
|---|---|---|
| Driest month: | January | 43mm 1.7ins |
| Sunniest month: | January | 6.4hrs |
| Coldest month: | January | 9.5°C 49.1°F |
| Wettest month: | June | 181mm 7.1ins |
| Warmest sea: | August | 26.3°C 79.3°F |
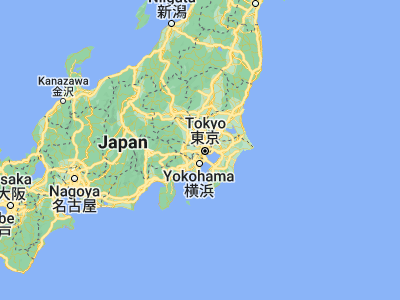

Locations nearby
Top Japan locations
- Fukuoka
- Hakodate
- Hakone
- Hiroshima
- Kagoshima
- Kamakura
- Kanazawa
- Kōbe
- Kyoto
- Nagoya
- Naha
- Nara
- Nikkō
- Ōsaka
- Sapporo
- Sendai
- Takayama
- Tokyo
- Yokohama